Order delivered
Review the statistics
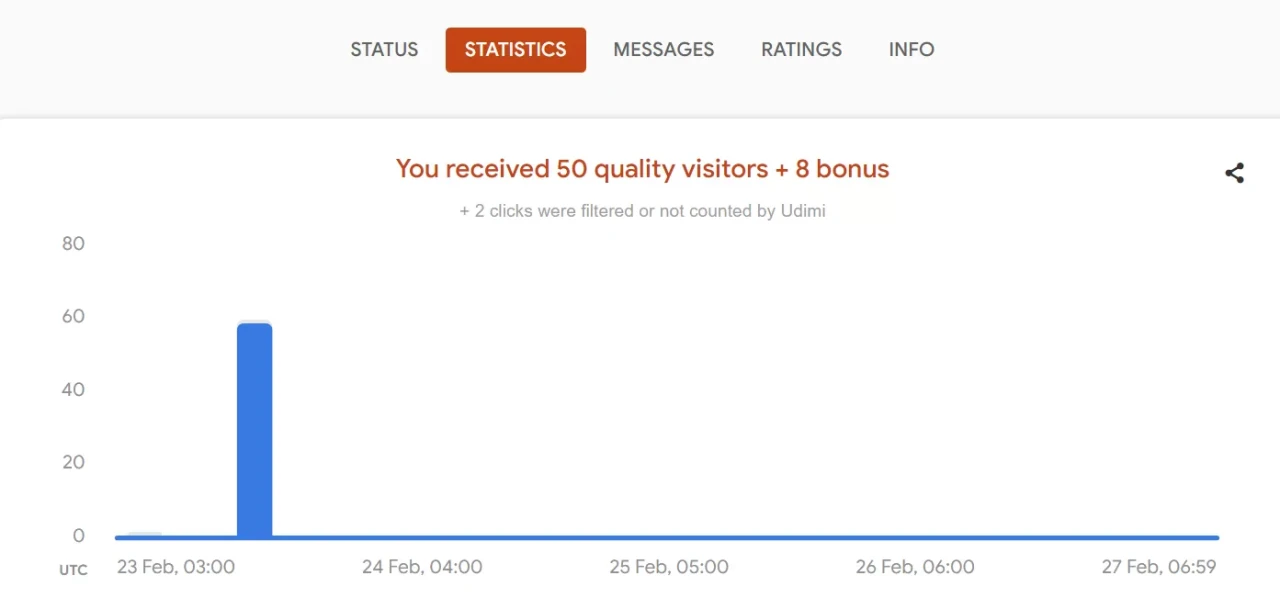
Click on a solo cell to view the statistics. If no graph appears on this screen, then the solo has not started yet.
Here, you can monitor all delivered traffic updated in real-time. Your seller has 100 hours to deliver all visitors, and the graph provides a breakdown of this delivery. Please note that all times are shown in the UTC time zone.
Below the graph, you can see last 10 clicks you have received.
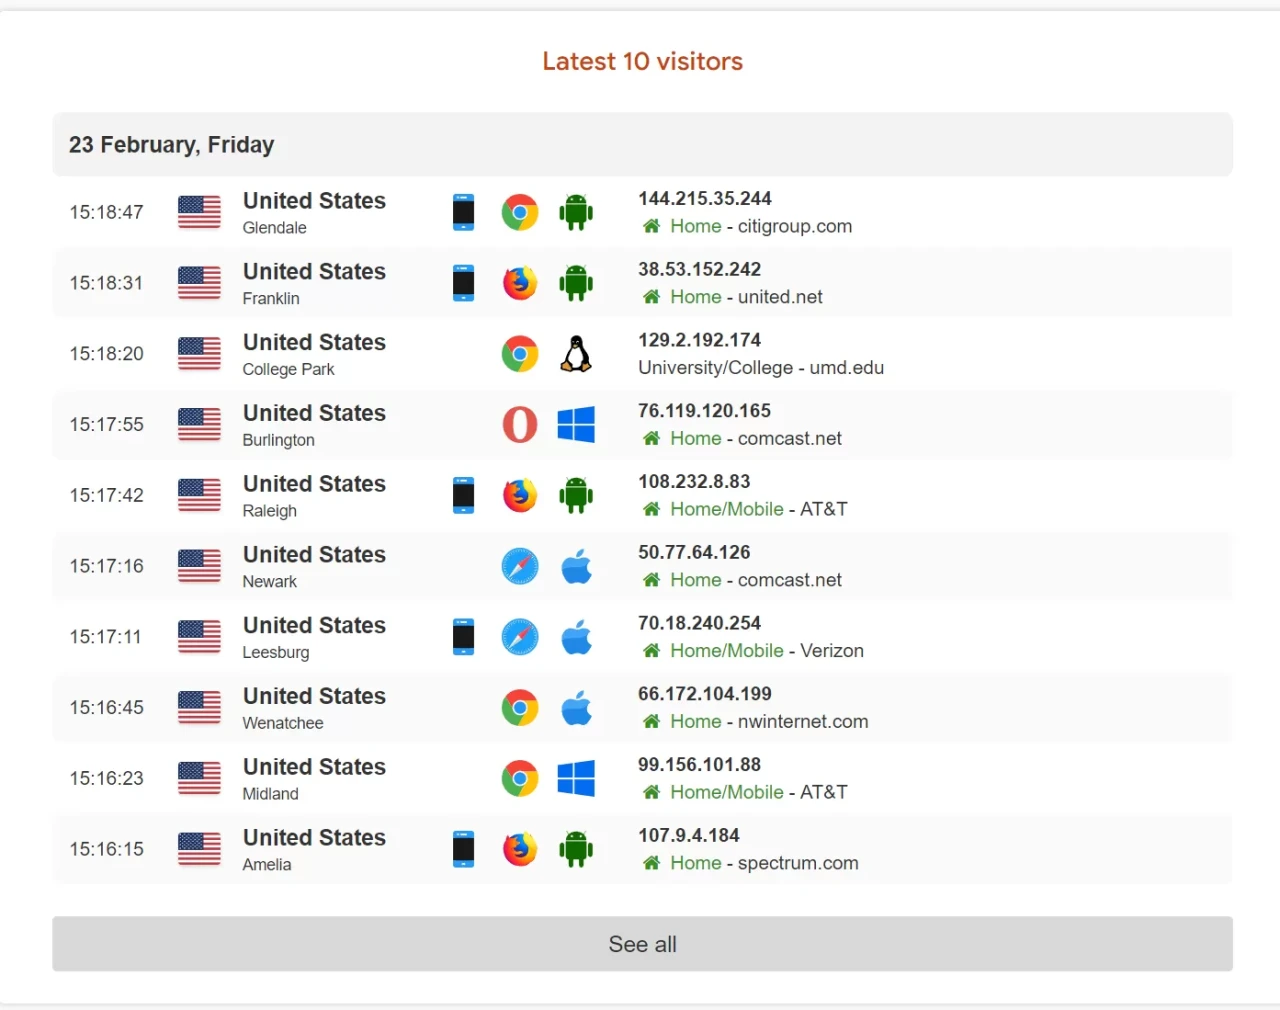
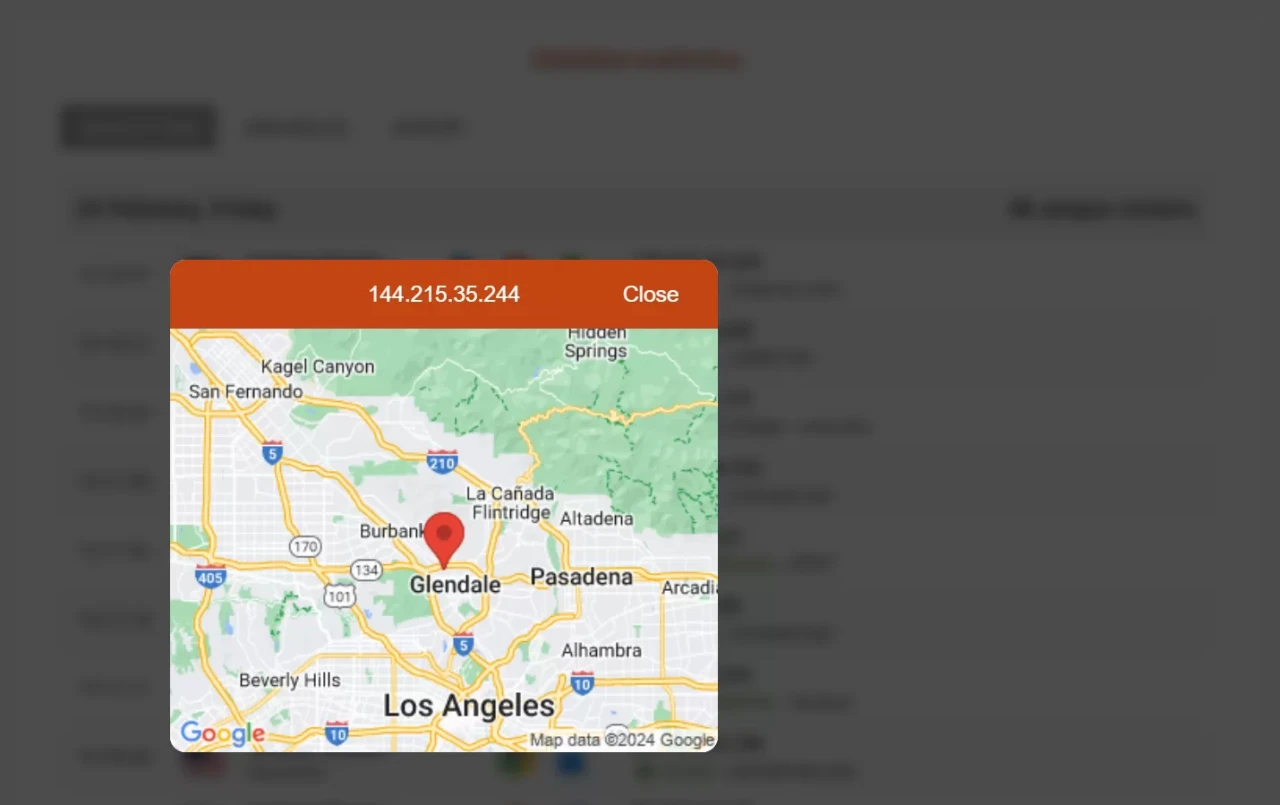
You may click any row to see visitor's location
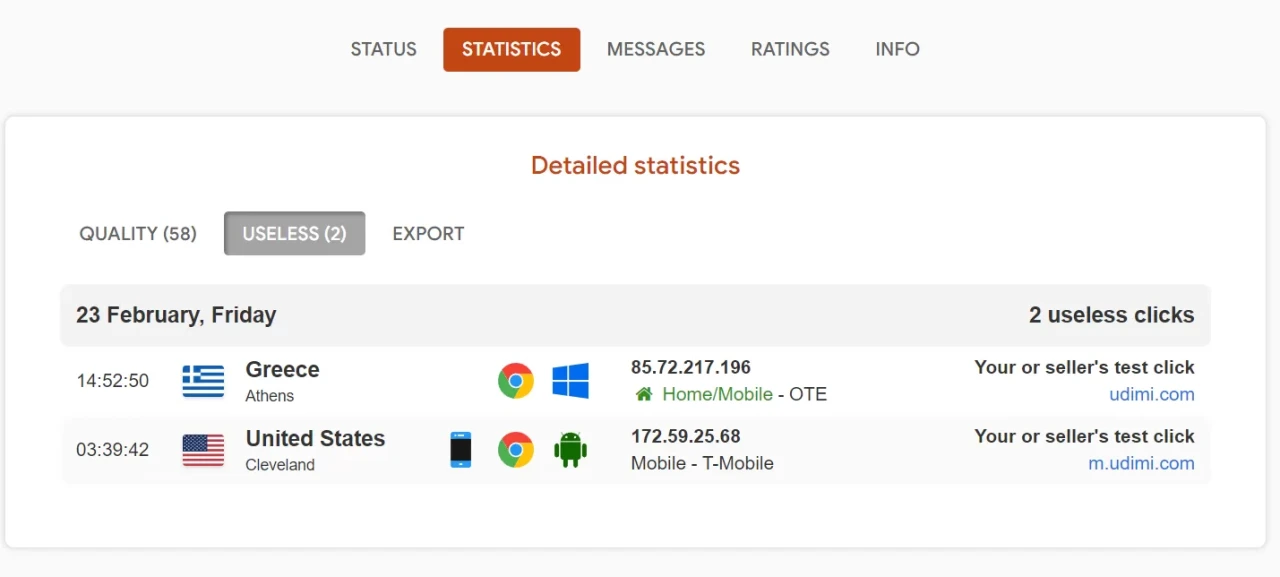
Click See all at the bottom to view detailed statistics for all your clicks: both quality and filtered by Udimi filter.
You can switch tabs to see Quality and Useless clicks. You can also export click stats using the Export tab.
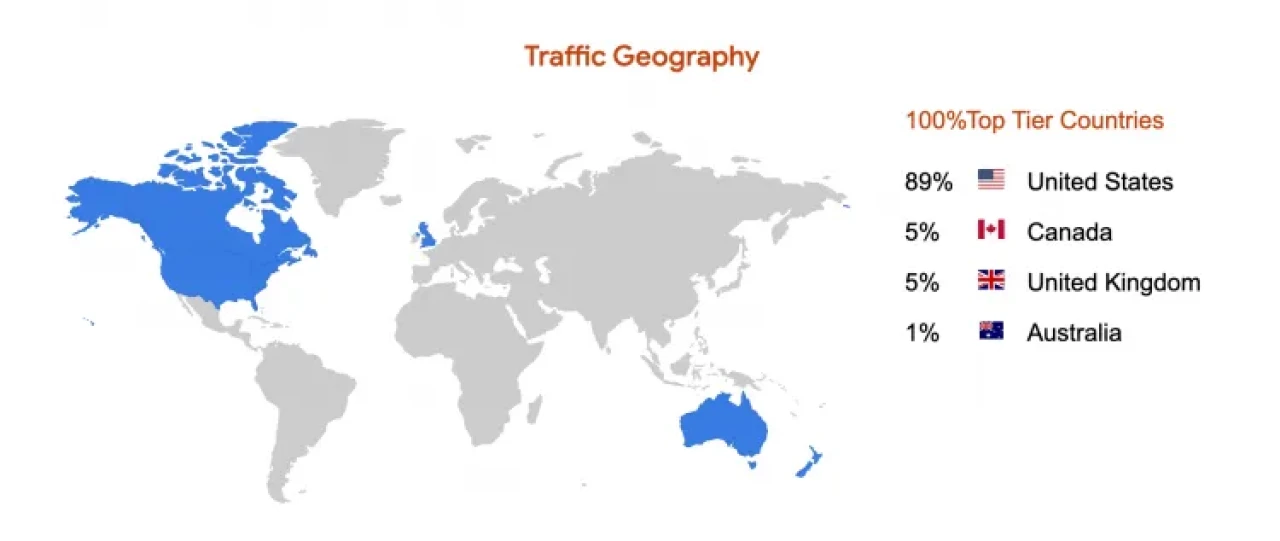
On the Stats screen you can also see the distribution of traffic by country and the percentage of each country.
If you are a Prime member of Udimi, we recommend that you use our Optin tracker to see all your opt-ins and their actions on your site.